Two methods for segmentation and customer group formation
With RFMR and customer contribution margin, companies receive two procedures for optimal resource management and controlling. An update to a previous article. The article from Wikipedia is also very “narrow”, so we would like to offer here a detailed version supported with the video for description and explanation. This means that didactically the video is the more beautiful variant. Quick readers will find their tips here in the text.
Part 1 on RFMR and customer contribution margin for optimal resource management
The measured customer
imalen resource control
It’s about measuring the customer. Is he presumptuous with what he demands? Or is it measured in the sense of evaluation?
It is important that a company knows a) what its needs are, b) what its peculiarities are and c) what its value is to the company. Or d) is the customer measured “in the sense of” sometimes making strange demands? These are above all those customers who are particularly large in sales. These companies know that they can exercise a certain power.

Figure 1: Customer Rating [1]
And that’s why the company always has to know whether this is a really good customer or maybe it is more of a good customer in terms of sales, but otherwise perhaps a rather difficult to unprofitable one?
Therefore, here is the classic question shown on a real example
Which of these three customers is the best customer now? Is that the left one? the middle or the right customer of the three?

Figure 2: Different customers [2]
Now let’s just take the farmer on the far right. He worked in the field. On Friday afternoon at 3:23 p.m., the following happens to him: He notices that something is broken, which is due to a small screw. The farmer now drives to our customer. Important to know: Our customer is a wholesaler for small parts products, a C-parts dealer. He has about 20,000 items in stock.
What happens now with this wholesale cash sale?
The customer wants to return to the field as quickly as possible with the screw, repair his machine and continue working. The story is told quickly. Customer comes to the counter, describes his problem. Yes, I need this screw. Seller: Ok, then he thinks, where do I get the screw, what is this article number? Then he goes to the warehouse, maybe opens a bag of hundreds, which is usually sold pre-packaged, because we are talking about a wholesaler here. This is therefore not available as bulk goods, but is just packed in bags.
The warehouse clerk takes out a screw, he has to adjust the stock in the system. He looks at what the whole thing costs, He hands over the screw to the seller. This records the process. And with this customer, it’s like this: To print the invoice, he has to walk up to the second floor. We quickly calculated this on the basis of estimated process costs. Conclusion: This process costs a minimum of 150 euros. The head of department for this area estimates that it could even cause costs of up to 200 euros. The small screw brings a turnover of about 5 euros. The legal costs of 150 euros are offset by 5 euros in turnover. Humph?
Part 2 on RFMR and customer contribution margin for optimal resource management
Is it worth it?
That is the obvious question. How does the employee react to this calculation? Answer “I want to serve the customer, I want to do something good for him!”
Now we are exactly at the important sensitization
If I carry out the process because this is a good customer, then he gets this complex process for 5 euros. Or he will no longer get the product in the future.
Another alternative: So suppose the customer value is low if the customer only comes by maybe once a year and then buys for only 5 euros. Then you could say: We have minimum order values of 50 euros or even 100 euros. So this is a completely different discussion. Then he buys the screw perhaps worth 5 euros for 100 euros.
Other alternative
You make another deal and say if he has something like that as a problem, then offer him an express delivery service. The customer calls you or sends you a photo of the spare part he is looking for via WhatsApp. If you know what kind of part it is, then a taxi, the bicycle courier or DHL goes out. and he sends the thing out for 200, 250 euros and then the customer is not three hours away from the field until he has done all this, but he can maybe even be able to produce again within half an hour and then it costs 200 euros or 250 euros. Ergo: Then that’s a cool service.
These above variants have to be weighed up and looked, do I do that now? Do I offer this service, to whom do I offer this service? What product price do I ask for, so price differentiation is actually a big question and that’s why we go deeper into the matter.
Part 3 on RFMR and customer contribution margin for optimal resource management
How can you segment customers now?
One thing is important in CRM: It is important to differentiate communication based on customer behavior. The end of the watering can! Not all customers are treated equally anymore.
The second important thing in CRM is to have a consistent assessment of customers
Assumption: If you now ask three employees about one of your customers – one from the field service, one from the back office and one from the accounting department, then you get three opinions. Suppose the customer always pays relatively late, then the person from accounting says: This is a bad customer, because he never pays on time. If you ask the sales force, he says: This is my best customer, because he makes an incredible amount of sales and I receive a high commission. The employee from the office says: His employees are constantly hanging in our ears, he constantly has questions about this and that. With every little thing he calls. Yes, it is not a bad customer, but it costs us a lot of time. Now you have exactly three opinions about this one customer.
Of course, this does not make sense, but all three employees should be able to make the same assessment of this clientele and evaluate according to the same grid and act according to the same grid.


Figure 3a, 3b: The end of the watering can and the gut feeling [3]
It’s about the end of the watering can you the “vague” gut feeling. See (Figure 3)
Part 4 on RFMR and customer contribution margin for optimal resource management
What are the evaluation procedures?
Figure 4: different customer evaluation procedures [4]
Figure 4 gives a first simple classification. Many will spontaneously think: sales are a common criterion. Next, there is the RFMR procedure. Then there is the classic contribution margin. What there is no detailed discussion about here is the customer value, often referred to as customer life time value. Why? Because there are very different definitions in science. In principle, this is a combination of customer gross margin and future potential.
For me, the pragmatic way for this post makes the most sense. The calculations are simple, comprehensible and the ideas that arise from them are implemented relatively quickly. And what is particularly important is the immediate, tangible effects of these measures.
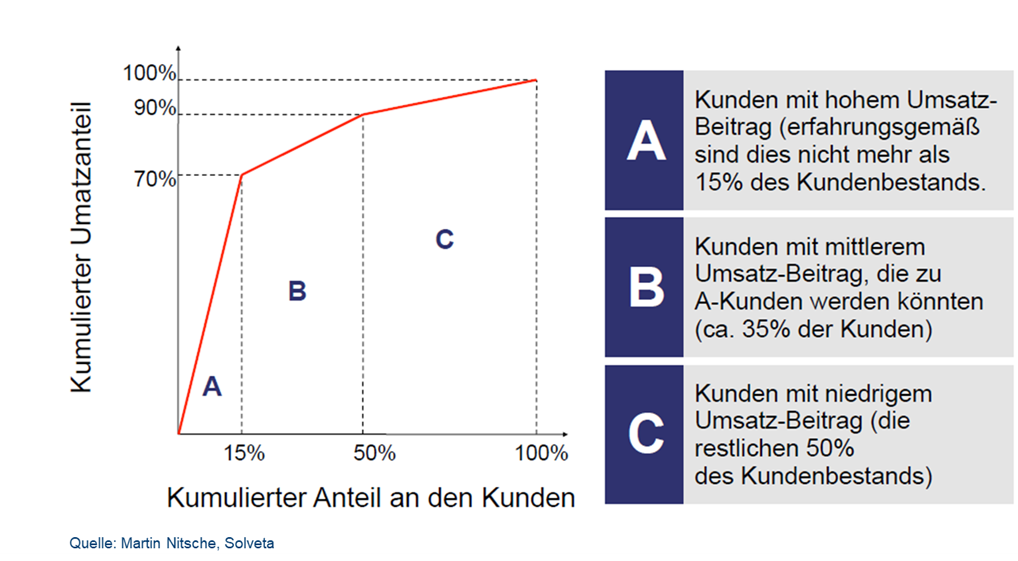
Figure 5: Typical revenue distribution of existing customers[5]
If you look at customers “by revenue” (Figure 5), the picture very often looks like this:
Approximately 15% of customers account for 70% of sales, the next best 35% bring about 20% and the rest of 50% of customers deliver about 10% of sales.
This is the usual structure that we find again and again or the Pareto 20/80 rule. I know a 30/70 rule from many projects. So 30% of customers make up 70% of sales. But that’s crazy in the end.
Anyone who controls in this way usually assumes that the more turnover, the better. Regardless of how many times you were last bought by whom.
Part 5 on RFMR and customer contribution margin for optimal resource management
The big question is, is the customer profitable with a lot of sales?
There are some studies that I have seen again and again in the last 20 years and one thing is clear that if you only look at sales, you certainly steer the ship relatively quickly into shallows or into unsafe waters. The example with the farmer is one example, the second example from the similar customer. He has an order once a year or every two years of a propeller worth 500,000 euros, otherwise this shipyard does not buy anything. But this unique propeller for 500,000 euros once a year and in the other case the farmer who buys a screw worth 5 euros once a year. These two examples quickly show these extreme possibilities. And they show why the criterion of turnover is a very weak criterion.
The RFMR method originates from the mail order business of the 1960s

Figure 6: Differentiation of active and passive customers [6]
First, a key question needs to be asked: Are we talking about active or passive customers? (Figure 6) This is defined here in this example as 12 months. That is, if the customer has had an activity, a purchase, an order, any reaction within the last 12 months of today, then by definition he is considered active. The duration of the active period is the next criterion. From today’s point of view (always taking the current date of the day) there must never be a longer break than 12 months between two orders. As long as the person or the company is considered active. The active period of classic trading is twelve months.
The 12 months are just one example. In the food retail sector, this can only be two or three months. But it can also be 24 or 36 months. That depends a bit on the business model, repurchase rhythm and the target group. But first of all, it is important to find a definition that says: I define who is active with me and who is passive in my clientele.
All active multiple buyers then remain as an analysis pool. As an analysis basis, all purchases on the billing header and billing individual item for the respective asset period are to be used.
Part 6 on RFMR and customer contribution margin for optimal resource management
This is the first step. Now comes the second step:
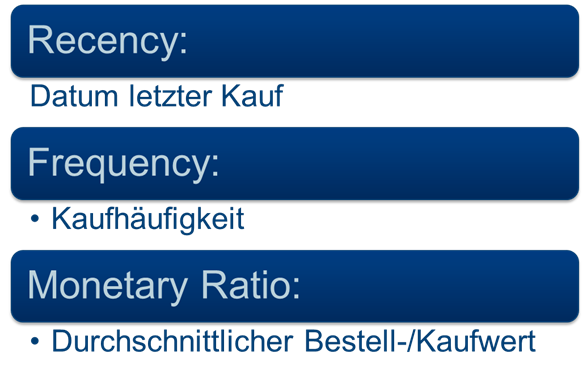
Figure 7: The three most important criteria of the RFMR method [7]
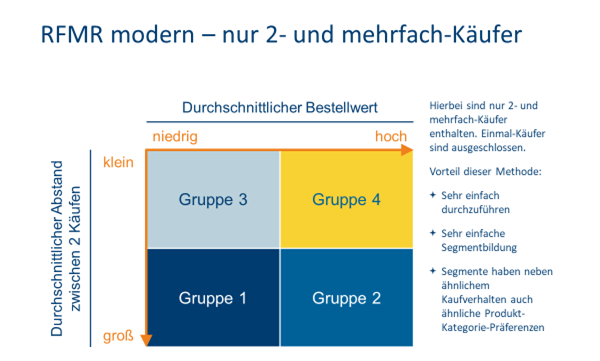
What are the RFMR criteria? (Figure 7) When was the date of the first or last purchase within this period? How many times did he buy during this period? And what is an average purchase and order value? If you have a service or a service company, it is accordingly the service value. Publishers may have to be viewed a little differently, but it works. And with the optician, it works too. From these values, a two-dimensional table (Figure 8) is then easily created.
Figure 8: Pattern result matrix of the RFMR method [8]
This table with its two important dimensions is quickly explained
First of all, on the left, the dimension one, the average distance between two purchases. Now an important note: So at the top left are those who have a small distance between two orders, so usually between two, three weeks or one, two months distance between two orders or between two calls. And at the lower end of the axis are those who have a long average distance between two orders. These customers order rather irregularly or rarely.
And now to the X-axis. It’s relatively simple. At the front left in the corner are the values with small or low order values. If you have a high order value, you are in the upper right corner. And in this respect it is clear that Group IV are the best customers, because they have a high priority and they have a relatively low distance or small distance between two orders, so order relatively regularly. And so, with this very simple basic idea, we go into the analysis of customer data. This can be for a fashion house, multi-channel packaging retailers, power tool manufacturers and many more examples.
The RFMR method is a very, very simple, but a very, very effective segmentation method
The author himself carried it out for the first time in 1993. And I can only say that it is still one of the best and fastest methods to first make a segmentation and to have an important advantage in the company. That’s all you do comprehensible.
The management understands this method immediately, and all other employees understand it as well. It is not rocket science. And the important thing is that in the beginning there is the confidence that this method is comprehensible and not somehow a logistic regression or any other statistical, lofty method where you can’t yet understand exactly how it came about. This is very, very important at the beginning.
Part 7 on RFMR and customer contribution margin for optimal resource management
Practical example of RFMR and its effectiveness:
With an example fashion house (Figure 9) – but could also be an example from B2B – the author can demonstrate what the RFMR method is for a “powerful tool”.

Figure 9: Result matrix of sample data of a retail company [9]
As in the basic explanation (Figure 8 in chapter 7.2.5.6), the distance between two purchases is the basis in Figure 9. On the right you will find the average cash receipt. Through the color areas you can always see the segments defined at the beginning.
The ochre-colored ones are a first contiguous group, the somewhat dark blue colored ones are another group. The light blue group is a third group. And so on. We did not use statistical methods here, but only used “common sense”.
This means that certain limits (from the point of view of column and row division) make sense
There are also areas, the yellow fields, which are simply not directly assigned to a group. Or the Apricot group, which may have gotten a little bigger. But because they are relatively small quantities, they have been summarized pragmatically. Through the univariate analyses that now follow, the analyst sees whether the classification makes sense or whether it is better to draw the boundaries differently or to assign a group (due to similarities) to another group.
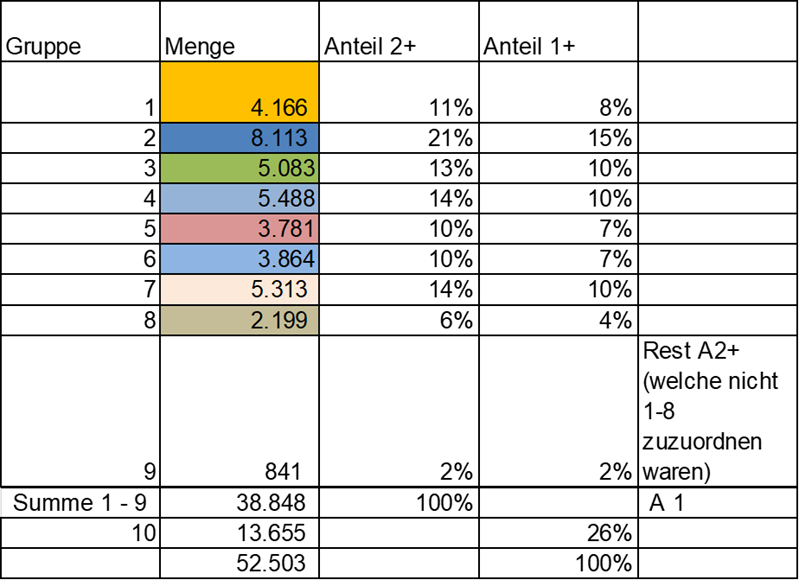
Figure 10: Breakdown of customer groups according to the RFMR method used [10]
That was step one. The analysis values come from a sample of 50,000 customers. (Figure 10) And now let’s look at the impact. We analyzed each individual group by univariate (Figure 11). What is the distribution between men and women? Or what is the age distribution of the individual groups?

Figure 11: Breakdown of customer groups according to the RFMR method used [11]
But what is even more exciting about the RFMR method, the groups are not only discriminated against via the socio-demographic analyses, but also show differences in purchasing behavior. (see Figure 12)
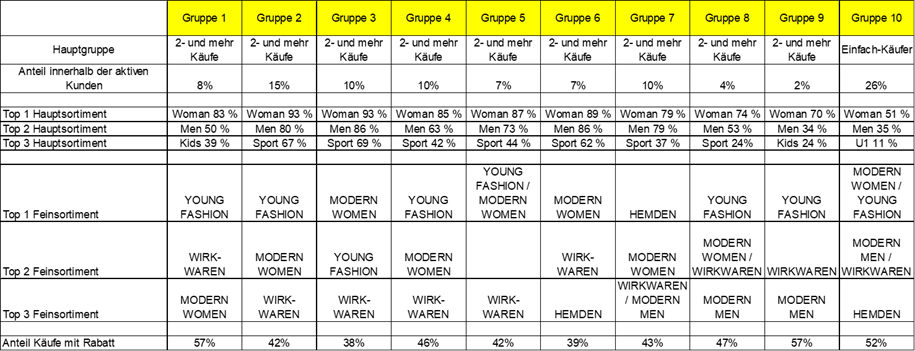
Figure 12: Breakdown of customer groups according to the RFMR method used [12]
Further questions
Who buys in which main assortment or in which fine assortments? What is the proportion of purchases with a discount? Statement of the customer: “Oh God, these are important target groups for us and we have a group here with 57% discount buyers. We have to be very careful about that.” And the question to us was: “Do discounts lead to more customer loyalty?” No, of course not. Ergo, a very important insight with which the company could immediately do something.
With these few examples, it is shown that important insights can quickly come about. With this modeling you often get very exciting approaches. What can I do now with these customers?
As I said, we do this in retail. E-commerce – can you do that?
Plastics industry, we have done everything, electrical tools and optics, packaging, manufacturers, dealers, operating equipment, retail trade. For example, we are currently doing this for the sports association. Again, it actually works. They were very happy. With very, very few steps of an adaptation, we have defined top customers, in this case members, or just defined mediocre members and less important members or members without potential, so that you could see relatively quickly who would have to adapt a few activities next year not only for certain target groups within the membership, so that a few members do not get out of hand. We have collected donations or publishers and many other examples.
Part 8 on RFMR and customer contribution margin for optimal resource management
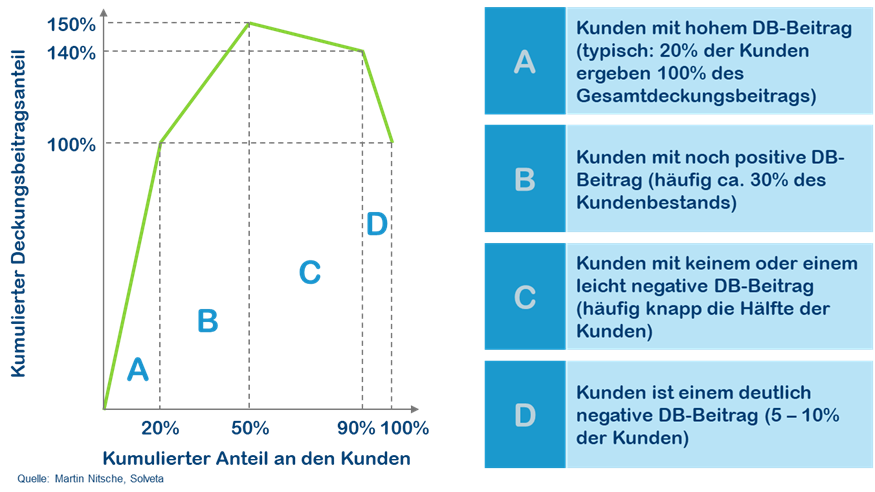
Figure 13: Typical contribution margin distribution of customers [13]
If a company wants to go one step further than the RMFRM method, this would be the customer contribution margin. Anyone who devotes themselves to the topic of contribution margin will find the following in an analysis (Figure 13): For example, 20 percent of customers generate 100 percent contribution margin for the company. With the next 30 percent, I increase the contribution margin by a value of X by an index value. And now, when I look at the next X percent customers, it turns out that with their negative contribution margin, they reduce the cumulative result. And the remaining 10 percent even really break the overall result.
With these projects or calculations, this painful realization occurs
But in the end it is a very positive realization, because this gut feeling, which the author mentioned at the beginning, suddenly disappears. It’s not about the turnover, it’s ultimately about the profit and the wealth, the contribution margin that a customer brings you.
Of course, one can say that there are customers for whom a negative contribution margin is accepted. There are usually reference customers or customers with a lot of potential. But somewhere, every company has to set “its” pain threshold. And that’s why it’s important to always take this look at customer profitability. Sales are not everything.
Part 9 on RFMR and customer contribution margin for optimal resource management
How is the customer gross margin determined?
This is not a particular science. In principle, it is simple: The company looks at what has been incurred in the past by the respective customers for directly attributable costs. And, if possible, indirect, variable costs are passed on to customers according to a redistribution key – as fairly as possible.
One considers which cost types there are that can be assigned to a customer. If possible, the whole thing is assigned directly to polluters. If you can’t assign this one-to-one, because the ERP or the merchandise management system or the accounting system does not exist, then you at least try to work with approximate values. And instead of a product contribution margin, this results in a customer contribution margin.
As a rule, we define the cost structures in a two-day analysis workshop
Sometimes a day and a half is enough. Afterwards, the accounting and/or controlling department get some homework to determine some important data. Which quantity structures are available for the respective cost type? What are real and estimated costs? Or what are approximate values – usually for variable costs – that can be allocated? And how can these cost parameters be assigned to a customer or a customer group in the best possible way?
Again, dear reader, you will probably say: “Hey, that’s absolutely the simplest mathematics”, not to say small basics.
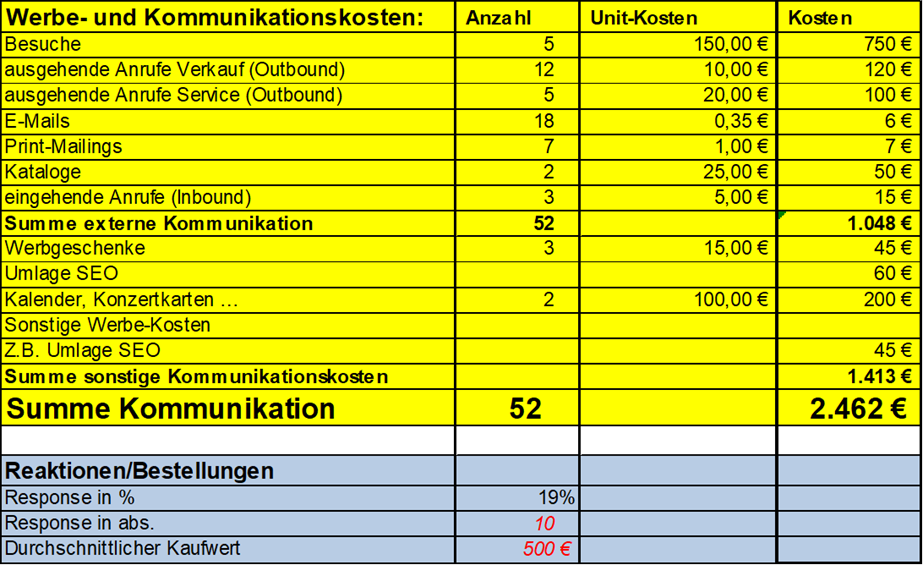
Figure 14: Sample costs for analyzing customer value [14]
You look at (see Figure 14) what advertising and communication processes have arisen for a customer. 1st line we see, this customer has received five visits. Per visit, a value of 150 euros is assigned as costs. Depending on the company and business model, it can be 100, 200 or even 300 euros. This question needs to be clarified: What does a field service visit cost on average?
Then outgoing calls (outbound) have been added. Once from the office staff (Inside Sales and once from the service. Every call costs money. The call from the service is more expensive because it often takes longer or more expensive staff is behind it. How much do the print mails, catalogues, etc. cost?
In addition to the directly attributable communication costs, there are the levies. These can also be flipped via unit values or distribution keys. in addition, promotional gifts are included, etc.
Interim conclusion:
This sample customer has been assigned 2,462 euros in communication costs. Everyone sees that it is simple basic work. This list is simply to be regarded as an example and suggestion. In principle, you can simply structure this and say: What can I do? Then there may be another area that I cannot assign and do not distribute sensibly via a levy. Then I’ll just let that out for now.
Part 10 on RFMR and customer contribution margin for optimal resource management
In the next step: What is the turnover and other costs against it?
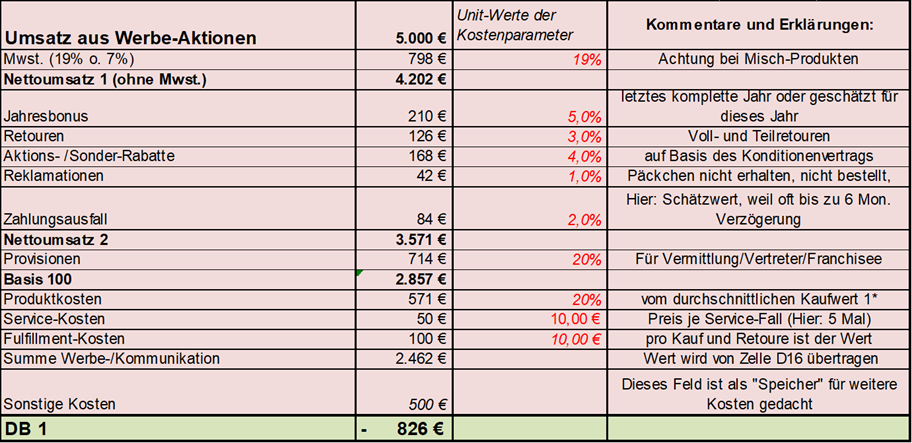
Figure 15: Sample calculation for determining a customer gross margin [15]
What happens next (see Figure 15)? What orders did he have, what was the average purchase value? Here, in this example, that’s 500 euros. For the fictitious ten orders, this is 5,000 euros in sales. Now you deduct the VAT. Then we have his annual bonus, deduct returns, then discounts, complaints, payment default, etc. are deducted. Not to forget the commissions for intermediaries or sales representatives. Then we have to consider product costs, service and fulfilment costs.
The result: Unfortunately negative. But that’s the naked information first. So what?
This sample customer has made 5,000 euros in sales. Without this line-up, many employees would have said: “This is a good customer”. And in the end it comes out: The customer is negative. But first of all, this is a naked piece of information with which you can do something.
First of all, this is an important insight, but what do I do with it now?
The following example (Figure 16) is from a C-parts dealer. So there are five different customer groups from the segmentation analysis. We have completed this form for each of these customer groups.
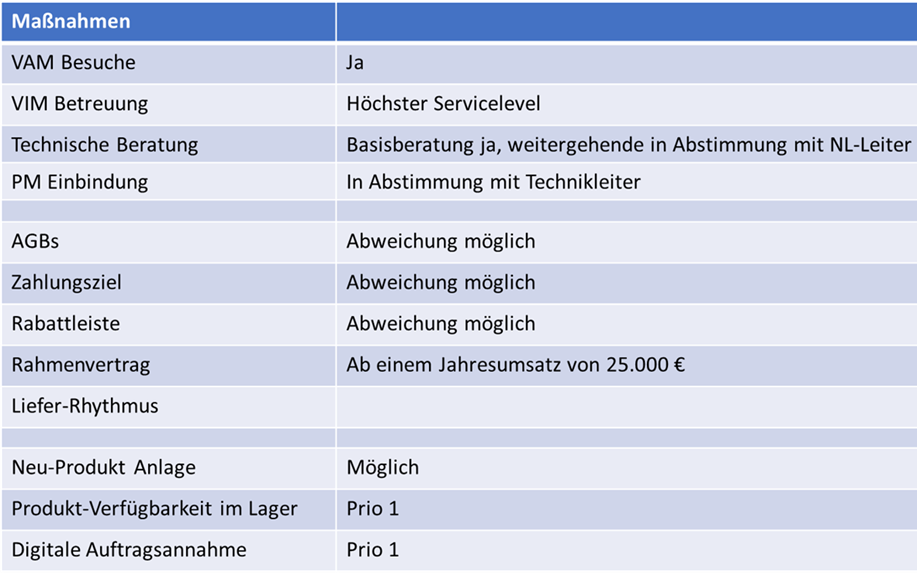
Figure 16: Sample measures kit for one of 5 target groups [16]
And now here we have the example of good customers. They still get field service visits. They get the best service level, they get technical advice and they get advice from product management.
In another customer group, these customers are not offered technical advice, only on request. Or they get technical advice, but it costs money. That was quite a paradigm shift. The company has never asked for money for this. It’s not that I always have to give everything away and treat everyone equally.
Or adjust the example of terms and conditions. For these top customers, it is allowed to adjust the terms and conditions. For all other customers, the terms and conditions are as they are. Payment terms may also be adjusted. The discount structures in the price list can be adjusted or at least discussed. From a certain turnover, it is even desired to conclude a framework agreement. The contract negotiation costs money and certainly brings something. But do you want to push this effort of a contract in the first place or just from a certain annual turnover – from here, for example, 25,000 euros?
Or there are different differentiations when it comes to delivery. If he always gets his deliveries free, how high is the number of free calls, there are the possibilities of retrievals at all – and so on.
What’s next? How often should you measure?
Of course, it is important to then look at the development of the customer gross margin. Is the individual customer improving or deteriorating? (see Figure 17)
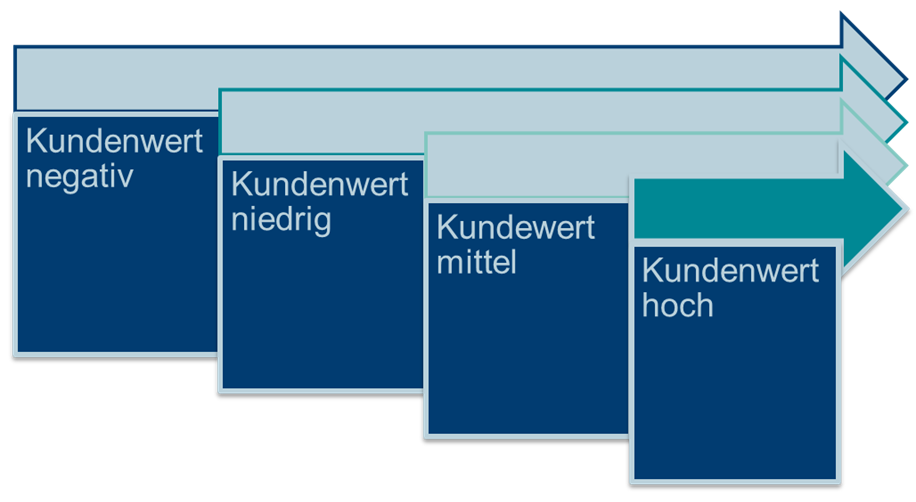
Figure 17: Possible customer value development [17]
This has to be measured and controlled.
Part 11 on RFMR and customer contribution margin for optimal resource management
Summary of the two methods RFMR and customer gross margin
Not all inquiries or customers are to be treated equally, but according to their customer value or contribution margin.
You can start with the RFMR and supplement it later with the contribution margin. Of course, the best thing is to combine both. On the one hand, the purchasing behavior (RFMR) and on the other hand, the value (customer gross margin) were included.
And both together are of course an extremely strong indicator of what the customer management of this customer group has to do next.
As already written elsewhere, no more than 4 to 6 strategic customer groups should be defined.
You think about each group 1 to 5: What are the SWOTs of this target and customer group? What goals do I have? What KPIs do I have? On the basis of the knowledge, I may even define group 6 so-called desired customers (here in Figure 27), because they are currently still missing or underrepresented.
And above all, define: How – with which measures (offers, products, services, conditions, etc.) – do you want to develop these customers
But there are customers where the company says they’re bad and that they probably won’t get better – for whatever reason. A tough decision follows, but it has to be made in the same way: You part with these customers. This means that instead of 100 customers, you only have 80. The advantage: The company concentrates 100% on the remaining 80 customers. Of course, this allows it to spend more time on the individual and thus increase the effectiveness by 20 percent.
By the way, the question has to be asked: How do you separate or say goodbye to customers? See detailed article here
But in the end, the company is much more successful, because it spends much more time with fewer leads and thus of course has a higher chance.
What do you get out of it?

Figure 18: Advantages and effects of the customer contribution margin analysis [18]
You can use the knowledge (Figure 18) for both customer acquisition and customer retention. If you sort out bad customers, you’ll have a lot more time for the fewer customers. This creates more customer loyalty. It usually also affects leadership and organization. Due to the customer value analysis, discussions are very quickly raised: We have to position ourselves differently for this. It is no longer the classic sales marketing service organization. The crucial thing is: It must be thought and acted on cross-functionally and accordingly, an organizational change is often the key to success. You plan and budget differently. They work together differently.
In practice, there are other processes for “customer value high” as for “customer value low”
They have a unified view and no longer just gut feeling. As a rule, decisions are always made according to a certain grid. There is no such thing as the “I slept badly today and decide differently”, the “I slept well” or the “I like you” situation. This means that everyone in the company has a common frame of reference and decision-making. You have a clear basis for decision-making.
You change or individualize prices. Yes, even with the same product there are different prices depending on the customer group. In addition, you end up changing the goals of the company.
This leads to more freedom of choice for employees
There is a different dunning process, the warehouse availability is controlled differently depending on the customer or visiting times can be extended. In the call center, the average handling time can be adjusted according to customer value. They change the division of territory in the field service. Services or means of communication are changing. The throughput times for processes can be prioritized accordingly.
So, in principle, the topic of customer value intervenes almost everywhere in the company and ultimately helps to create or optimize a profitable and a profitable company. That means focusing at the end.
Less is more, but usually more profitability
To conclude by George Bernard Shaw: The only person who behaves sensibly is my tailor. He takes new measurements every time he meets me, while everyone else always applies the old standards in the opinion that they still fit today. I’ve adapted this a bit for all of them: The only person who behaves sensibly is your employee, because he can consult the customer more and take new measures every time and act accordingly.
Additional notes or list of figures:
[1] AdobeStock.com
[2] Pixabay.com
[3] are both of AdobeStock.com
[5] Martin Nitsche Solveta, from the DDA- German Dialogue Marketing Script 2015
[13] Martin Nitsche Solveta, from the DDA- German Dialogue Marketing Script 2015
Self-presentations 1A Relations GmbH (partly anonymized)
[4] [6] [7] [8] [9] [10] [11] [12] [14] [15] [16] [17] [18]


